Đề bài: The bar chart shows the different modes of transport used to travel to and from work in one European city in 1960, 1980 and 2000.
Bài viết:
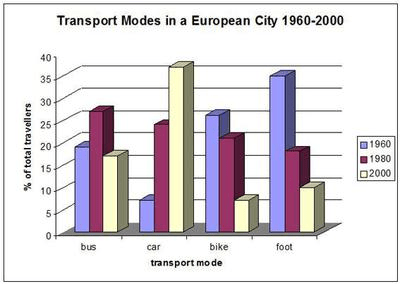
The bar chart illustrates the information about the proportion of travellers who used different types of vehicles to commute to work in a European city during a period from 1960 to 2000.
Overall, the percentage of commuters who used cars rose steadily over the period, while the proportion of people who travelled by other means of transport fell.
In 1960, approximately 35% of people commuted to work on foot, compared to only about 5% of people travelled by car. The percentage of those who used bikes and buses were around 25% and 18% respectively. However, in 1980 travelling by bus was by far the most popular transport mode, accounting for over a quarter of total travellers, whereas only 17% of people travelling on foot. The figures for bike and car were around 20% and 22% respectively.
At the end of the period, more than one-third of commuters used cars to commute to work in this city in 2000, which was much higher than / doubled the figure for bus users, at around 16%. The percentage of those who travelled to work on foot and by bike fell to 9% and 6% respectively.

Bình luận về bài viết này