Đề bài:
The chart below shows the amount of leisure time enjoyed by men and women of different employment status. Write a report describing the information shown below.
Bài viết:
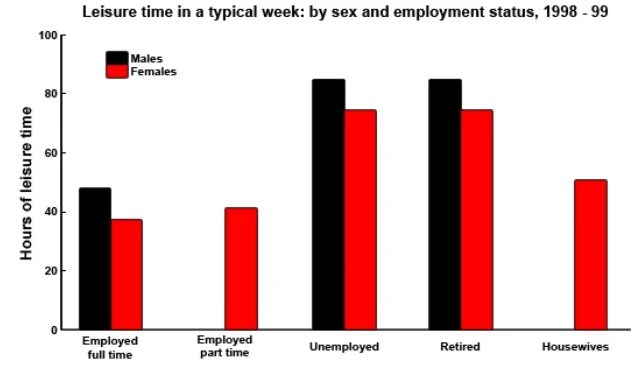
The bar chart compares the amount of free time per week that males and females of five categories of employment status had between 1998 and 1999.
It is clear that men enjoyed more hours of leisure time per week than women in three out of five categories. However, only figures for women are shown in two categories, namely employed part-time and housewives.
Regarding the full-time employed, obviously men had slightly more leisure time than women, with approximately 45 hours of free time per week, compared to around 38 hours for women. Obviously, unemployed and retired people of both genders enjoyed the most hours of leisure time. Moreover, the figures for retired males and females were exactly the same as those for the unemployed, at around 85 and 78 hours of free time per week, respectively.
Housewives enjoyed 50 hours of spare time, a little more than part-time working women who had just over 40 leisure hours each week. No data is given for men in either of these categories.

Bình luận về bài viết này